stimuli.audio.Noise🔗
- class stimuli.audio.Noise(color, volume, duration, sample_rate=None, device=None, n_channels=1, *, backend='sounddevice', clock=<class 'stimuli.time._clock.Clock'>, **kwargs)[source]🔗
Colored noise stimulus.
- Parameters:
- color
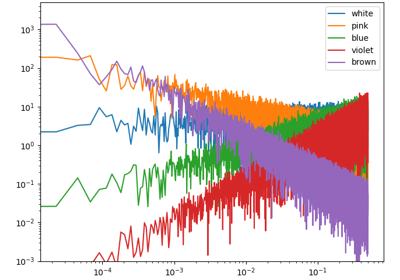
'white'|'pink'|'blue'|'violet'|'brown' The name of the noise color.
- volume
float|listoffloat|tupleoffloat|arrayoffloat Volume of the sound as a percentage between 0 and 100. If a
floatis provided, the same volume is used for all channels. If a sequence is provided, the length must match the number of channels.- duration
float Duration of the sound in seconds, used to generate the time array.
- sample_rate
int|None Sample rate of the sound. If None, the default sample rate of the device provided by the backend is used.
- device
int|None Device index to use for sound playback. If None, the default device provided by the backend is used.
- n_channels
int Number of channels of the sound.
- backend
"sounddevice" The backend to use for sound playback.
- clock
stimuli.time.BaseClockclass Clock object to use for timing measurements. By default, the
stimuli.time.Clockclass is used.- **kwargs
Additional keyword arguments passed to the backend initialization.
- color
Attributes
The color of the noise.
The duration of the audio stimulus.
The sample rate of the audio stimulus.
The audio signal.
The time array of the audio stimulus.
The volume of the audio stimulus per channel given as a percentage.
Window applied to the audio signal.
Methods
play([when, blocking])Play the audio data.
plot()Plot the audio signal waveform.
save(fname, *[, overwrite])Save the audio stimulus to a WAV file.
stop()Interrupt immediately the playback of the audio data.
- play(when=None, *, blocking=False)[source]🔗
Play the audio data.
- Parameters:
- when
float|None The relative time in seconds when to start playing the audio data. For instance,
0.2will start playing in 200 ms. IfNone, the audio data is played as soon as possible. A duration superior to the device latency is recommended.- blocking
bool If True, the function blocks until the audio playback is finished.
- when
- plot()[source]🔗
Plot the audio signal waveform.
- Returns:
- f
matplotlib.figure.Figure The matplotlib figure object.
- ax
matplotlib.axes.Axes The matplotlib axes object.
- f
- save(fname, *, overwrite=False)[source]🔗
Save the audio stimulus to a WAV file.
The saving is handled by
scipy.io.wavfile.write().- Parameters:
- fname
str|pathlib.Path Path to the output file. The extension should be
'.wav'.- overwrite
bool If True, existing files are overwritten.
- fname
