Note
Go to the end to download the full example code.
Colored noise🔗
A noise signal is produced by a stochastic process. The color of noise, also called the noise spectrum, refers to the power spectrum of a noise signal.
The practice of naming kinds of noise after colors started with white noise,
a signal whose spectrum has equal power within any equal interval of
frequencies. That name was given by analogy with white light, which was
(incorrectly) assumed to have such a flat power spectrum over the visible
range. Other color names, such as pink, red, and blue were then
given to noise with other spectral profiles, often (but not always) in
reference to the color of light with similar spectra. Some of those names
have standard definitions in certain disciplines, while others are very
informal and poorly defined.
Source: Wikipedia
import numpy as np
from matplotlib import pyplot as plt

from stimuli.audio import Noise
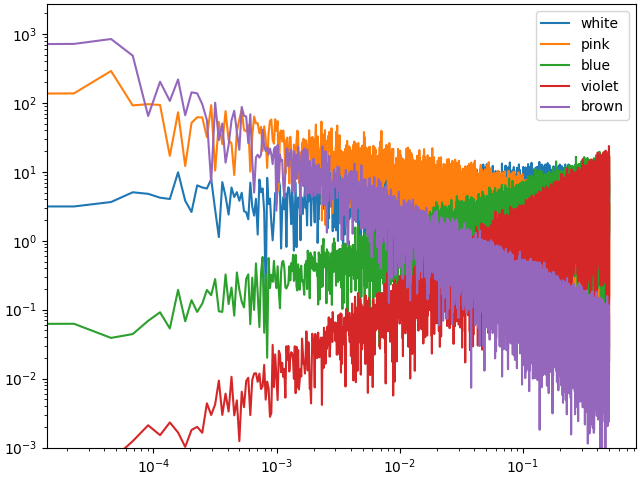
In this tutorial, we will create and plot the power spectrum of different
noise colors. stimuli implements several noise color in
Noise. Refer to the documentation of the color
argument for available colors.
We can listen to each individual noise by playing each sound with
play().
for sound in sounds.values():
    sound.play(blocking=True)
The underlying signal is stored in the stimuli.audio.Noise.signal
property, a numpy ndarray of shape (n_samples, n_channels). In
this case, the sound was set to mono so the signal has shape (n_samples, 1).
plt.figure(layout="constrained")
for color in colors:
    signal = sounds[color].signal.squeeze()
    # compute the one-dimensional discrete fourier transform
    frequencies = np.fft.rfftfreq(signal.size)
    dft = np.abs(np.fft.rfft(signal))
    # plot with log scaling on both X and Y axis
    plt.loglog(frequencies, dft)
plt.legend(colors)
plt.ylim([1e-3, None])
plt.show()

Total running time of the script: (0 minutes 12.857 seconds)
Estimated memory usage: 150 MB